How Endpoint Telemetry Works: The Hidden Data Pipeline
Endpoint telemetry transforms raw binary noise into structured intelligence, yet the collection phase often discards the context needed to prove intent.
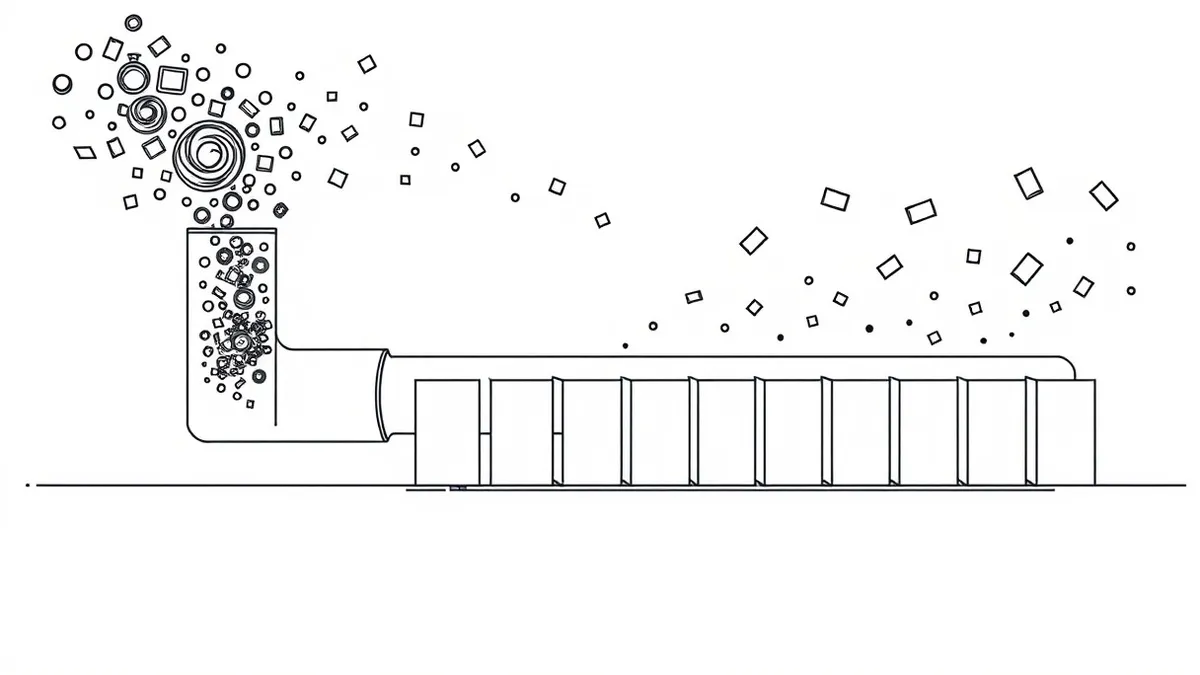
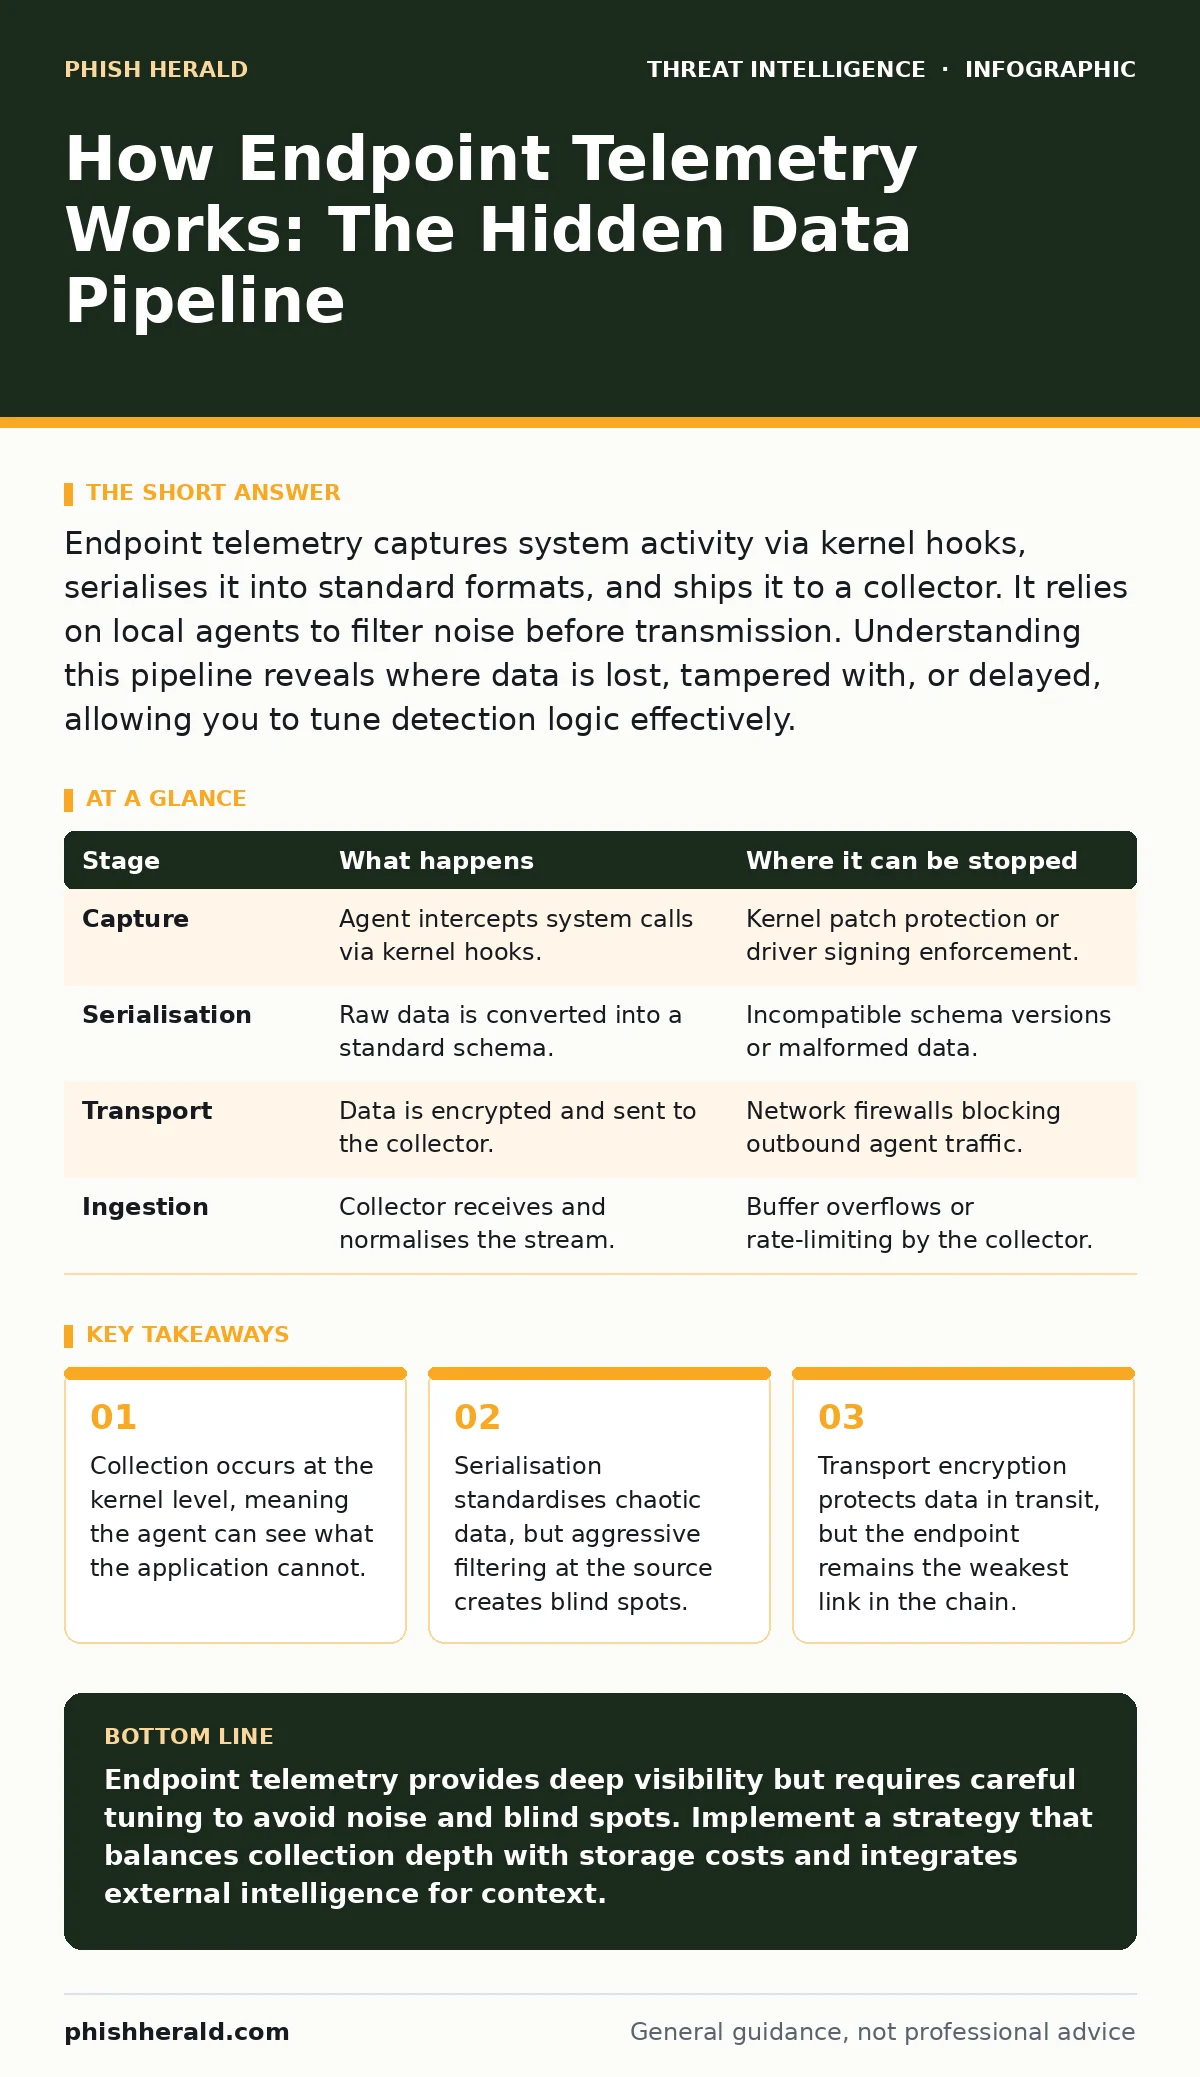
Endpoint telemetry captures system activity via kernel hooks, serialises it into standard formats, and ships it to a collector. It relies on local agents to filter noise before transmission. Understanding this pipeline reveals where data is lost, tampered with, or delayed, allowing you to tune detection logic effectively.
The Kernel Hook Mechanism
You must understand that the endpoint agent does not merely watch the screen. It inserts itself into the operating system kernel, the core software that manages hardware and processes. This insertion, known as a hook, allows the agent to intercept system calls before the operating system fully processes them.
When a process attempts to execute, the kernel hands control to the agent first. The agent checks the request against a policy. If the policy allows it, the agent logs the event and passes control back. If the policy blocks it, the agent terminates the request.
This position grants visibility into hidden actions. A malicious script running in memory without a file on disk is invisible to a standard file scanner. The kernel hook sees the memory allocation and the API calls the script makes. This is the foundation of behavioural detection.
However, this depth comes with a cost. Kernel-level access is powerful but dangerous. A buggy agent can crash the entire operating system. You balance visibility against stability. The agent must be lightweight enough to run unnoticed but deep enough to catch sophisticated threats.
Stage 1: Event Capture
The process begins with the identification of a trigger. The agent monitors specific system calls, such as process creation, file access, or registry modifications. It does not record every single event, as the volume would be unmanageable. Instead, it uses allow-lists and deny-lists to filter noise.
For example, the agent might ignore routine updates from a trusted publisher but flag any attempt to modify system boot files. This filtering happens in microseconds. The agent captures the raw data associated with the event, including the process ID, the user context, and the timestamp.
| Stage | What happens | Where it can be stopped |
|---|---|---|
| Capture | Agent intercepts system calls via kernel hooks. | Kernel patch protection or driver signing enforcement. |
| Serialisation | Raw data is converted into a standard schema. | Incompatible schema versions or malformed data. |
| Transport | Data is encrypted and sent to the collector. | Network firewalls blocking outbound agent traffic. |
| Ingestion | Collector receives and normalises the stream. | Buffer overflows or rate-limiting by the collector. |
Stage 2: Data Serialisation
Raw system data is chaotic. It contains binary values, pointers, and internal structures that vary between operating system versions. The agent must convert this into a consistent format. This process is called serialisation.
Common standards include JSON or Protocol Buffers. These formats allow different tools to read the data without custom parsers. The agent maps the raw event to a predefined schema. For instance, a file creation event is mapped to fields like file_path, process_name, and creation_time.
This step is where context can be lost. If the schema does not include a field for the parent process ID, you lose the ability to trace the lineage of the action. You cannot see what spawned the malicious script. This is a common limitation in older telemetry implementations.
Stage 3: Secure Transport
Once serialised, the data must leave the endpoint. Sending raw data over the network is insecure. The agent encrypts the payload using TLS, the same protocol that secures web traffic. This ensures that an attacker on the network cannot read the telemetry.
The agent then sends the data to a central collector. This collector might be on-premises or in the cloud. The agent uses a keep-alive connection to maintain a steady stream. If the connection drops, the agent buffers the data locally and retries when the connection is restored.
Network segmentation can complicate this. If the endpoint is in a restricted zone, it may not have direct access to the collector. You must configure proxy servers or specific firewall rules to allow the agent traffic. Blocking this traffic stops the telemetry pipeline entirely.
Stage 4: Ingestion and Normalisation
The collector receives the encrypted stream. It decrypts the payload and validates the schema. If the data matches the expected format, it is ingested into the security data lake. If not, it is discarded or flagged for review.
Normalisation occurs here. The collector converts all timestamps to UTC. It resolves hostnames to IP addresses if possible. It enriches the data with static intelligence, such as the reputation of the IP address or the known vulnerability status of the host.
This stage is critical for correlation. Without normalisation, comparing events from different endpoints is difficult. One endpoint might report time in local time, while another uses UTC. The collector aligns these differences to create a unified timeline.
Limits of Endpoint Visibility
Endpoint telemetry is not omniscient. It relies on the honesty of the operating system. If an attacker compromises the kernel, they can hide their activity from the agent. This is known as rootkit behaviour. The agent sees what the kernel tells it to see.
Furthermore, encryption at the application layer can hide content. The agent can see that a process is accessing a file, but it cannot see the contents of an encrypted database. You detect the action, but not the data exfiltration.
This is why you need complementary controls. network detection and response can see the encrypted traffic leaving the network, even if the endpoint cannot see the payload. Combining these views reduces blind spots.
Engineering Effective Detections
Raw telemetry is noise. You need rules to find the signal. detection engineering focuses on creating rules that identify malicious patterns while minimising false positives. This requires understanding the baseline behaviour of your environment.
You might use YARA rules to scan memory dumps for known malware signatures. These rules look for specific byte sequences or strings within the data. They are effective against known threats but fail against new, polymorphic malware.
For unknown threats, you rely on behavioural analysis. user and entity behavior analytics establishes a baseline for normal activity. It flags deviations, such as a user logging in from an unusual location or a process accessing sensitive files at odd hours.
Integrating External Intelligence
Endpoint data is local. To understand the broader context, you must integrate external intelligence. STIX and TAXII are standards for sharing threat intelligence. They allow you to ingest indicators of compromise from trusted sources.
If your telemetry shows an outbound connection to an IP address listed in a threat feed, the collector can flag it immediately. This reduces the time to detect known bad actors. However, this does not help with targeted attacks that use clean infrastructure.
You should also monitor cybercrime forums for emerging tactics. While you cannot directly integrate forum data into your telemetry, understanding the current trends helps you refine your detection rules. For instance, if attackers are focusing on token theft, you should increase logging for credential access events.
The Cost of Depth
Deep telemetry requires significant storage and processing power. You must decide how long to retain data. Retaining raw events for months is expensive.
This aggregation saves space but loses detail. You can see that a process ran, but you cannot replay the exact sequence of API calls. This limits your ability to investigate historical incidents. You must balance cost against investigative capability.
See also: Signature Based Detection in Cyber Security: Mechanisms and Blind Spots · Endpoint Protection for Small Business: Budget Strategies That Work
Handling Advanced Adversaries
nation-state cyber attacks often use custom tools that evade standard signatures. These attackers operate slowly, blending in with normal traffic. Endpoint telemetry is your primary defence against this stealth.
By analysing the sequence of actions, you can identify the slow burn. A single event is harmless. A series of events, such as reconnaissance, lateral movement, and data staging, forms a pattern. Your detection rules must look for these sequences, not just individual events.
This requires patience and precision. You must tune your rules to ignore the noise of daily operations. The goal is to catch the attacker before they exfiltrate data. This is a continuous process of refinement.
Key takeaways
- Collection occurs at the kernel level, meaning the agent can see what the application cannot.
- Serialisation standardises chaotic data, but aggressive filtering at the source creates blind spots.
- Transport encryption protects data in transit, but the endpoint remains the weakest link in the chain.
Endpoint telemetry provides deep visibility but requires careful tuning to avoid noise and blind spots. Implement a strategy that balances collection depth with storage costs and integrates external intelligence for context.
Frequently asked questions
Does endpoint telemetry slow down my computers?
Modern agents are optimised to use minimal resources. However, collecting high-fidelity data can impact performance on older hardware. You should test agents in a non-production environment first.
Can endpoint telemetry detect ransomware?
It can detect the behavioural signs of ransomware, such as rapid file encryption. It cannot always stop the encryption if the attacker has already compromised the system. Prevention relies on segmentation and backups.
How do I handle privacy concerns with employee monitoring?
Define clear policies on what data is collected. Exclude personal devices and private browsing sessions. Anonymise user identifiers where possible. Transparency builds trust and compliance.
Is cloud-native telemetry different?
Cloud endpoints often use lightweight agents or agentless collection via API. The data structure is similar, but the transport mechanism differs. You must ensure the cloud provider’s security model aligns with your needs.
How this guide was produced: written by the Phish Herald editorial team with AI assistance, checked against the public references listed below, and reviewed when the facts change. See our editorial policy or report an error.