Implement User and Entity Behavior Analytics: A Practical Step-by-Step Approach
Most organisations fail at user and entity behaviour analytics because they treat it as a monitoring tool rather than a modelling exercise that requires continuous baseline refinement.

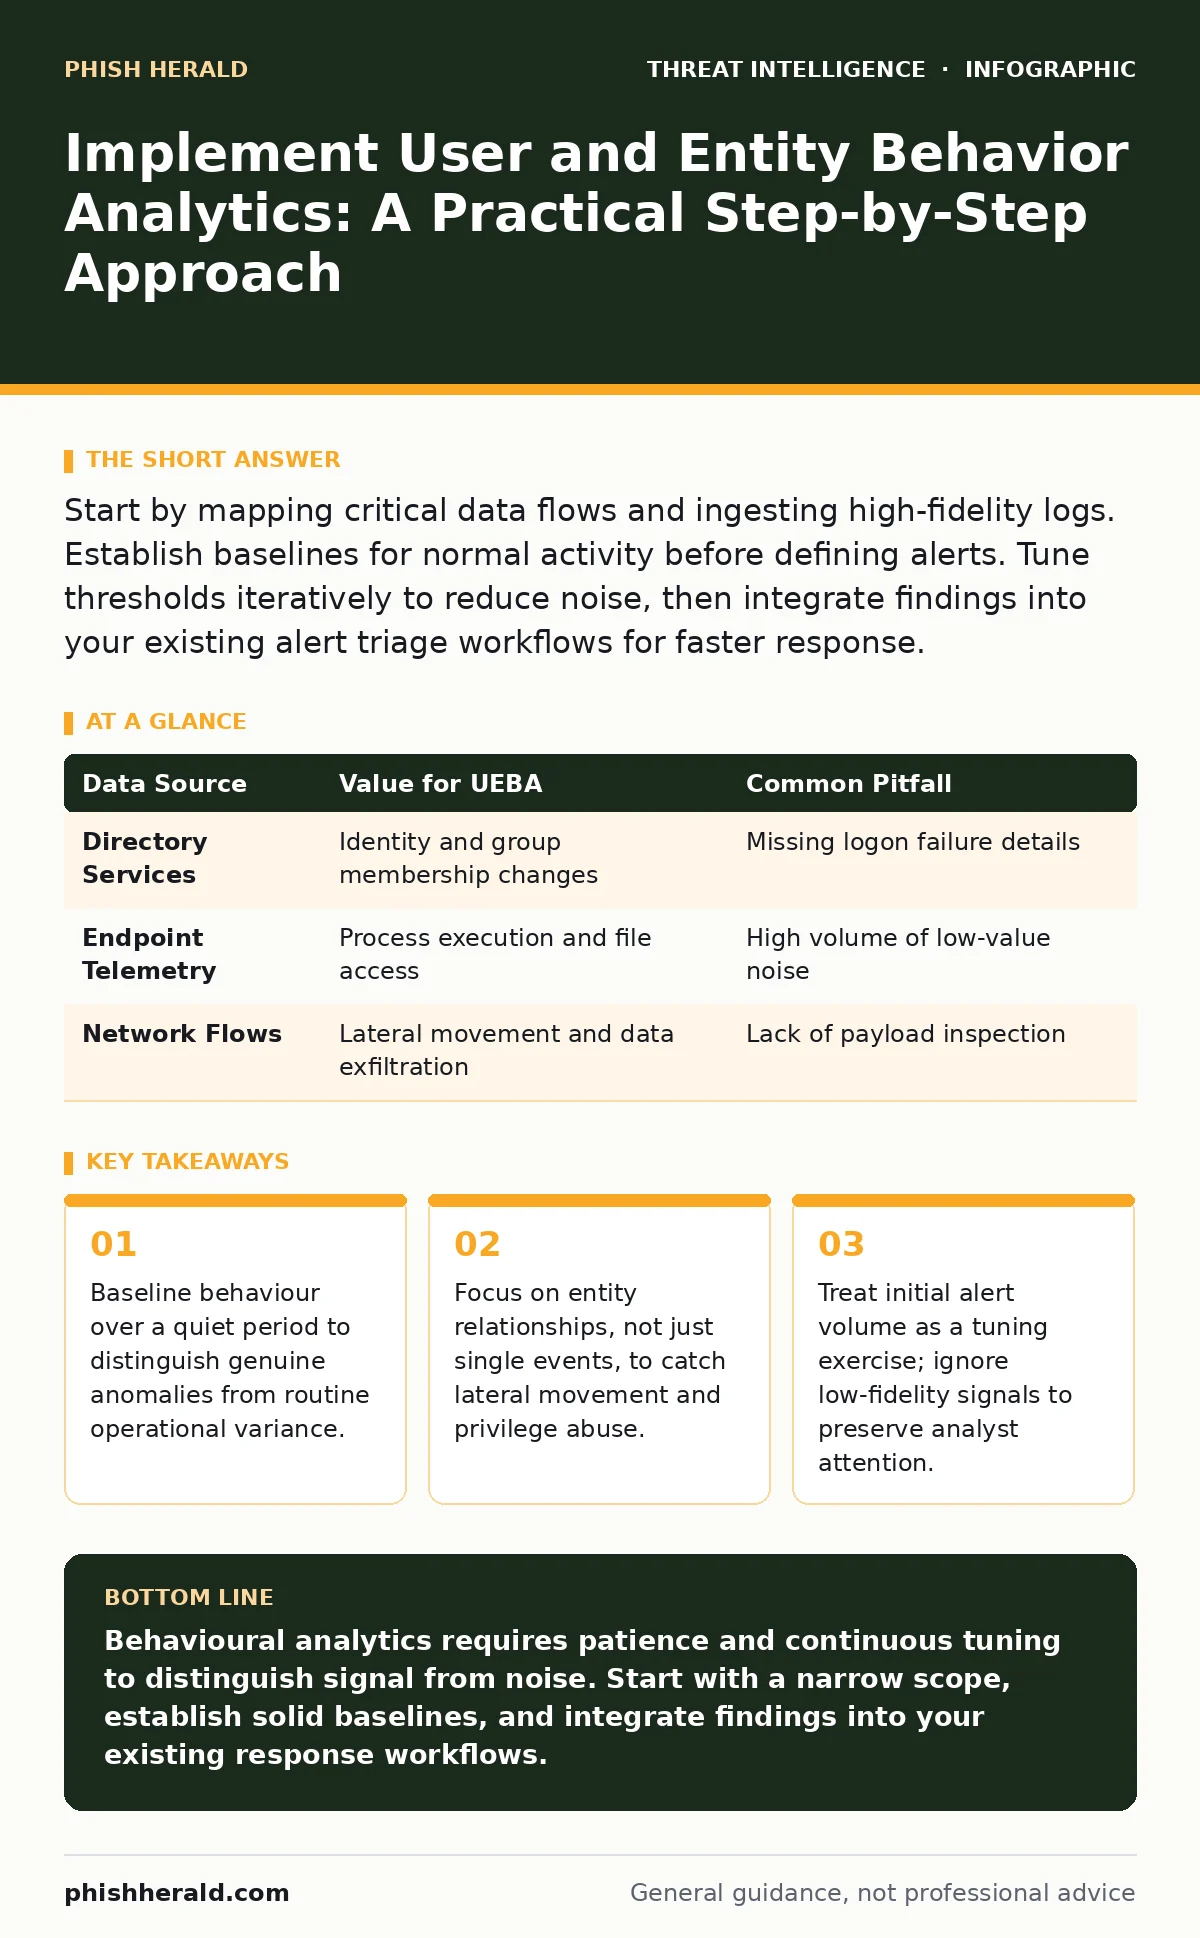
Start by mapping critical data flows and ingesting high-fidelity logs. Establish baselines for normal activity before defining alerts. Tune thresholds iteratively to reduce noise, then integrate findings into your existing alert triage workflows for faster response.
Defining the Scope of Normality
User and entity behaviour analytics relies on statistical models to identify deviations from established patterns. You cannot detect anomalies if the system does not know what normal looks like. This requires a period of observation where you record baseline activity without triggering alerts. During this phase, you are teaching the system the rhythm of your environment.
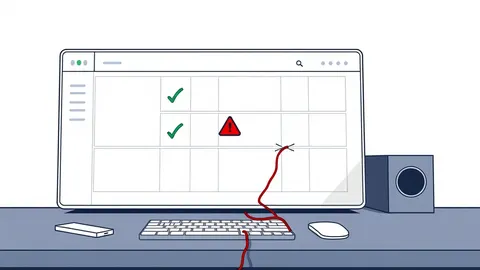
Imagine a finance department that typically accesses shared drives between 09:00 and 17:00. If the system sees access at 03:00, it flags it. But if the finance team regularly works late during month-end closes, that 03:00 access is normal. Without this context, every late-night login becomes a false positive.
You must identify which entities matter most. Not every user or server warrants the same level of scrutiny. Focus on accounts with high privileges, access to sensitive data, or connectivity to external networks. This prioritisation ensures your resources are spent where the risk is highest.
Data Ingestion and Normalisation
The quality of your analytics depends entirely on the data you feed it. You need consistent, timestamped logs from endpoints, directories, and network devices. Inconsistent time formats or missing fields break the correlation engine. Ensure all systems synchronise their clocks using a standard protocol.
Ingest logs that describe actions, not just connections. A firewall log shows a connection was made. An application log shows what file was opened or what command was run. You need the latter to understand intent. Combine these sources to create a unified view of entity behaviour.
| Data Source | Value for UEBA | Common Pitfall |
|---|---|---|
| Directory Services | Identity and group membership changes | Missing logon failure details |
| Endpoint Telemetry | Process execution and file access | High volume of low-value noise |
| Network Flows | Lateral movement and data exfiltration | Lack of payload inspection |
Establishing Baselines and Profiles
Once data flows into the platform, you must allow time for baseline generation. Most systems require two to four weeks of data to build a stable profile. Do not rush this. A rushed baseline captures temporary anomalies as normal behaviour.
During this period, monitor the system’s confidence levels. You are looking for the point where the model stops fluctuating wildly and settles into a predictable pattern. This is your starting point for detection. Any deviation from this settled state is a candidate for investigation.
You should also segment users by role. A developer’s baseline will look very different from an HR manager’s. Comparing them directly creates noise. Grouping by function allows the system to apply context-aware thresholds. This reduces false positives significantly.
Configuring Initial Detection Rules
With baselines in place, you can define what constitutes a threat. Start with high-confidence, low-volume indicators. For example, a service account logging in from a new geographic location is rare and suspicious. A user downloading a large file is common and less suspicious.
Avoid complex rules initially. Simple deviations are easier to validate and tune. As you gain confidence, introduce more nuanced rules that combine multiple signals. For instance, a user accessing sensitive data shortly after a failed login attempt is more concerning than either event alone.
Integrate these rules with your existing network detection and response capabilities. This allows you to correlate behavioural anomalies with network-level indicators. If a user’s behaviour is anomalous and their device is communicating with a known command-and-control server, the confidence in the alert increases.
Tuning and Validation
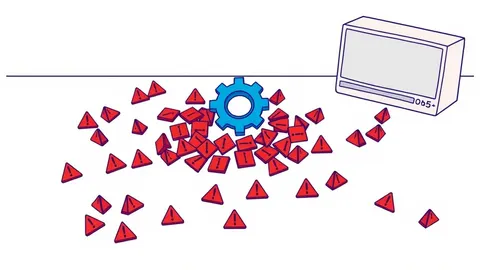
The first few weeks of active monitoring will produce noise. This is expected. You must tune the system to ignore benign anomalies. Review every alert to understand why it fired. Was it a legitimate business activity? If so, adjust the baseline or add an exception.
Use this feedback loop to refine your models. The system learns from your actions. If you dismiss an alert as false, the system should adjust its sensitivity for similar events. This continuous improvement is vital for long-term success.
See also: What Is Alert Fatigue: How to Stop Security Noise from Blinding Your Team · Alert Triage Checklist: Stop False Positives Before They Stop You
Operational Integration
Detection is useless without response. Integrate your analytics platform into your alert triage processes. Ensure that behavioural alerts are prioritised correctly.
Define clear playbooks for common anomalies. When a user’s behaviour deviates significantly, what steps should an analyst take? Does it require account lockout? Further investigation? Clear procedures reduce response time and ensure consistency.
Consider how these insights inform your broader security strategy. Behavioural analytics can reveal gaps in your access controls. If many users are accessing resources they do not need, your least-privilege policy may be failing. Use these insights to strengthen your overall posture.
Verification Checklist
Before declaring the implementation successful, verify these points:
- Baselines are stable and segmented by user role.
- Data ingestion covers all critical assets and is time-synchronised.
- Initial rules are tuned to minimise false positives.
- Analysts have clear procedures for investigating behavioural alerts.
- Feedback from investigations is used to refine models.
Maintenance and Evolution
Security is not static. Your environment changes, and so do the threats. You must regularly review and update your baselines and rules. New applications, changes in business processes, or shifts in user behaviour all require model adjustments.
Stay informed about emerging threats. New attack techniques may not trigger existing rules. For example, pass-the-ticket attacks may not generate traditional login alerts. Ensure your analytics can detect these subtle deviations.
Regularly assess the performance of your platform. Are you detecting threats faster? Is the noise level manageable? If not, revisit your data sources and tuning processes. Continuous improvement is the only way to maintain effectiveness.
Key takeaways
- Baseline behaviour over a quiet period to distinguish genuine anomalies from routine operational variance.
- Focus on entity relationships, not just single events, to catch lateral movement and privilege abuse.
- Treat initial alert volume as a tuning exercise; ignore low-fidelity signals to preserve analyst attention.
Behavioural analytics requires patience and continuous tuning to distinguish signal from noise. Start with a narrow scope, establish solid baselines, and integrate findings into your existing response workflows.
Frequently asked questions
How long does it take to implement user and entity behaviour analytics?
Initial setup and baseline generation typically take two to four weeks, but tuning and integration can continue for months.
Does user and entity behaviour analytics replace other security tools?
No, it complements them by providing context and reducing noise, but it does not replace endpoint protection or network monitoring.
What data is most critical for accurate behaviour analytics?
Identity logs, endpoint telemetry, and network flow data are essential for building comprehensive entity profiles.
How do you handle false positives in behaviour analytics?
Use a feedback loop to review and dismiss false positives, allowing the system to learn and adjust its thresholds.
How this guide was produced: written by the Phish Herald editorial team with AI assistance, checked against the public references listed below, and reviewed when the facts change. See our editorial policy or report an error.